Portfolio planning
In this section of PWM we test the performance and volatility of two investment strategies using model portfolios. Each month we look at two baskets of shares – one global and one European.
EUROPEAN PORTFOLIO
The tactics for this very interesting strategy, which is now based mostly on growth sectors, changed in the September 2003 issue.
At the end of last summer, probabilities indicated that the bullish move in the stock market could last into mid-2004 and thus that a high yield strategy in growth stocks would be best.
Technology stocks have lost some of their glamour, but the overall growth stock segment might still represent the best choice for the next few months.
The selection process is simple, as only stocks with a top- quartile yield and a dividend coverage of at least 50 per cent are chosen. Additionally, only pan-European stocks that show a top-quartile capitalisation are taken into consideration.
Only six stocks currently meet this requirement, however they are all located in the emerging pharmaceutical and defence electronics sectors, as the high technology segment of the market has become too expensive. The scatter diagram (chart 2) shows that the portfolio (blue square) shows better return and risk characteristics than the index, despite limited diversification.
Chart 1 (above): The September 2003 portfolio has shown excellent performance (+15.75%) against the Stoxx 50 Index (+6.57%) with a difference of +9.18%. Even the Stoxx Technology Index was beaten by a slight margin of (+0.46%). The annual gross yield of the portfolio was about 4%, which should also be added to the performance figures.
These stocks can be considered growth investments which are enhanced by a good dividend and high coverage. This might be very important in an environment where balance sheet could be under renewed stress during an economic turndown.
The table above shows the quantitative indicators for the portfolio and the index.
In Chart 2 (above) the defense stocks are placed above the linear regression line because of the above average returns over the past 12 months.
GLOBAL PORTFOLIO
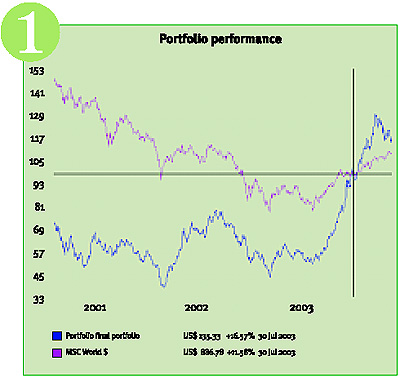
This strategy, presented in the September 2003 issue, has shown excellent results. The dollar-based portfolio (+ 16.57 per cent) has beaten the MSCI World $ Index (+ 11.58 per cent) by + 4.99 per cent.
The allocation process of this global momentum approach is threefold and can be considered top down, meaning that the type of markets and capitalisation segments are selected first, followed by the best sectors and, last but not least, the best stocks.
The benefits of using this strategy have decreased over the last six weeks, as the average Asian stock peaked at the beginning of November and profit taking has occurred in the technology sector.
Today’s allocation favours Latin America and Hong Kong with the top five sectors to consider in these countries being internet software, shipping, communications equipment, tobacco and electronic equipment.
This is a “China weighted” portfolio that should sustain its momentum for at least three months.
The best strategy is to repeat the allocation process after three months, in order to avoid the draw down that occurred in the previous portfolio.
In Chart 1 (above) the blue line shows the results of the top down allocation against the MSCI World $ Index.
Chart 2 (above) shows that the portfolio is heavily weighted in the industrial sector. The previous portfolio was exclusively concentrated in the technology sector.
Chart 3 (above): The heat map shows that the Hong Kong stocks should be able to keep their role as leaders among the comparatively strongest markets for at least another three months.
A list of the 10 components of the portfolio with a time horizon of 3 to 6 months.
For further information on Brainpower’s professional portfolio analysis software, please visit www.brainpowerweb.com or contact Andrew Deakin on +44 (0)20 7337 9123


