Portfolio planning
In this section of PWM we test the performance and volatility of two investment strategies using model portfolios. Each month we look at two distinct approaches – one global and one European.
GLOBAL PORTFOLIO
A high Dividend Yield can add value to any kind of strategy
Recent studies conducted by Credit Suisse Private Banking show that a high dividend yield can create a very successful strategy on its own in markets that show no buoyant bull characteristics. Creating a portfolio of 600 top capitalisation stocks with a dividend yield of 2 per cent or more and rebalancing it at the beginning of each year has beaten a portfolio of stocks that pays no dividend almost every year over a quarter of a century. This strategy underperforms only in very strong bull moves, such as 1999, but for the rest of the time it moves in line or does better than a portfolio that pays no dividends.
Bearing this in mind, a strategy that tries to take advantage of high yielding stocks combined with the Sortino Ratio – a return/risk measure – was applied for the first time in May 2003. The three basic ingredients of the strategy are therefore an excellent risk reward measure in relation to the benchmark, as well as a high dividend yield and a high dividend coverage through earnings. The results have been excellent, to say the least.
The May 2003 portfolio (minimum dividend yield requirement of +4 per cent or more) has for the last 10 months given a return of +74.20 per cent, compared to a gain of +22.21 per cent in the MSCI World Index $ and this does not even take into account the excellent dividend yield. The strong gains of the equity indices since March 2003 required a less restrictive minimum dividend yield, as a result it was decreased from +4 per cent to +3 per cent. The February 2004 portfolio has nevertheless achieved a profit of +1.18 per cent compared with a loss in the MSCI World Index $ (-2.78 per cent).
What would a portfolio look like on the basis of today’s prices?
Chart 1: This is not the kind of performance you would expect from a high yield stock portfolio. It is in fact a new portfolio containing some familiar names.
In the table below, Carnival PLC and EMI PLC are probably the two best known stocks.
This portfolio is achieving an average dividend yield of +3.792 per cent, more than the present money market funds in euro and US dollars.
Chart 2: If you had been expecting a boring defensive portfolio, this is not the case. Most of the sectors are represented although Financials and Technology are underweight.
EUROPEAN PORTFOLIO
Alternative ways of Benchmarking
In the October 2003 issue of PWM, we discovered that market capitalisation weighted benchmarking – where only the highest capitalisation stocks are taken into consideration – was about the only way to gain a slight edge over the benchmark whilst remaining very correlated.
The testing of the strategy that was carried out before and after the writing of this section for the October 2003 issue of PWM confirms that a slight edge can be gained.
Results have been very precise with a slight performance advantage in favour of the benchmarked portfolio.
Unfortunately this has not been the case for the first portfolio we presented in 2003, which started under performing slightly two months after inception.
However, the historical back testing shows that this slight underperformance is an exception. Let us therefore create a new portfolio for the next six months with the objective of staying closely benchmarked whilst gaining a slight advantage in terms of the comparative return.
Most readers might prefer ETFs (exchange-traded funds) to track the major indexes. Would it be possible to achieve reasonable results by using a very small number of stocks, possibly only five?
The result can be quite accurate at times, but sometimes the correlation is so low that this approach cannot be used. Ten stocks is probably the lowest possible number that is feasible.
The table above shows there are only 10 stocks in the portfolio, which is a low but usually efficient diversification of the risk.
Chart 1, at left: For a three-week period the portfolio underperformed the benchmark but then returned to normal.
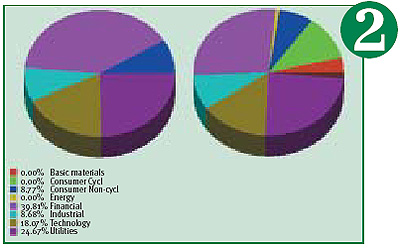
In Chart 2 below, the left pie represents the benchmarked portfolio, with the right one representing the Eurostoxx50 Index. An overweight position is noticeable in Financials.
This chart illustrates the evolution of the correlation, which has remained very stable over time especially since summer 2002.
Data, charts and comment supplied by Brainpower
For further information on
Brainpower’s professional portfolio analysis software, please visit www.brainpowerweb.com
or contact Andrew Deakin on
+44 (0) 20 7337 9123


